CandleStick Analysis Course

Candlestick Analysis Course

5 (85 Rating) 205 Students Enrolled

Eligibility
Basic Technical Analysis
Language
English, Hindi, Bengali
Learning Mode
Online Classroom
Duration
3 Months
Faculty
Mr. Susanta Malik

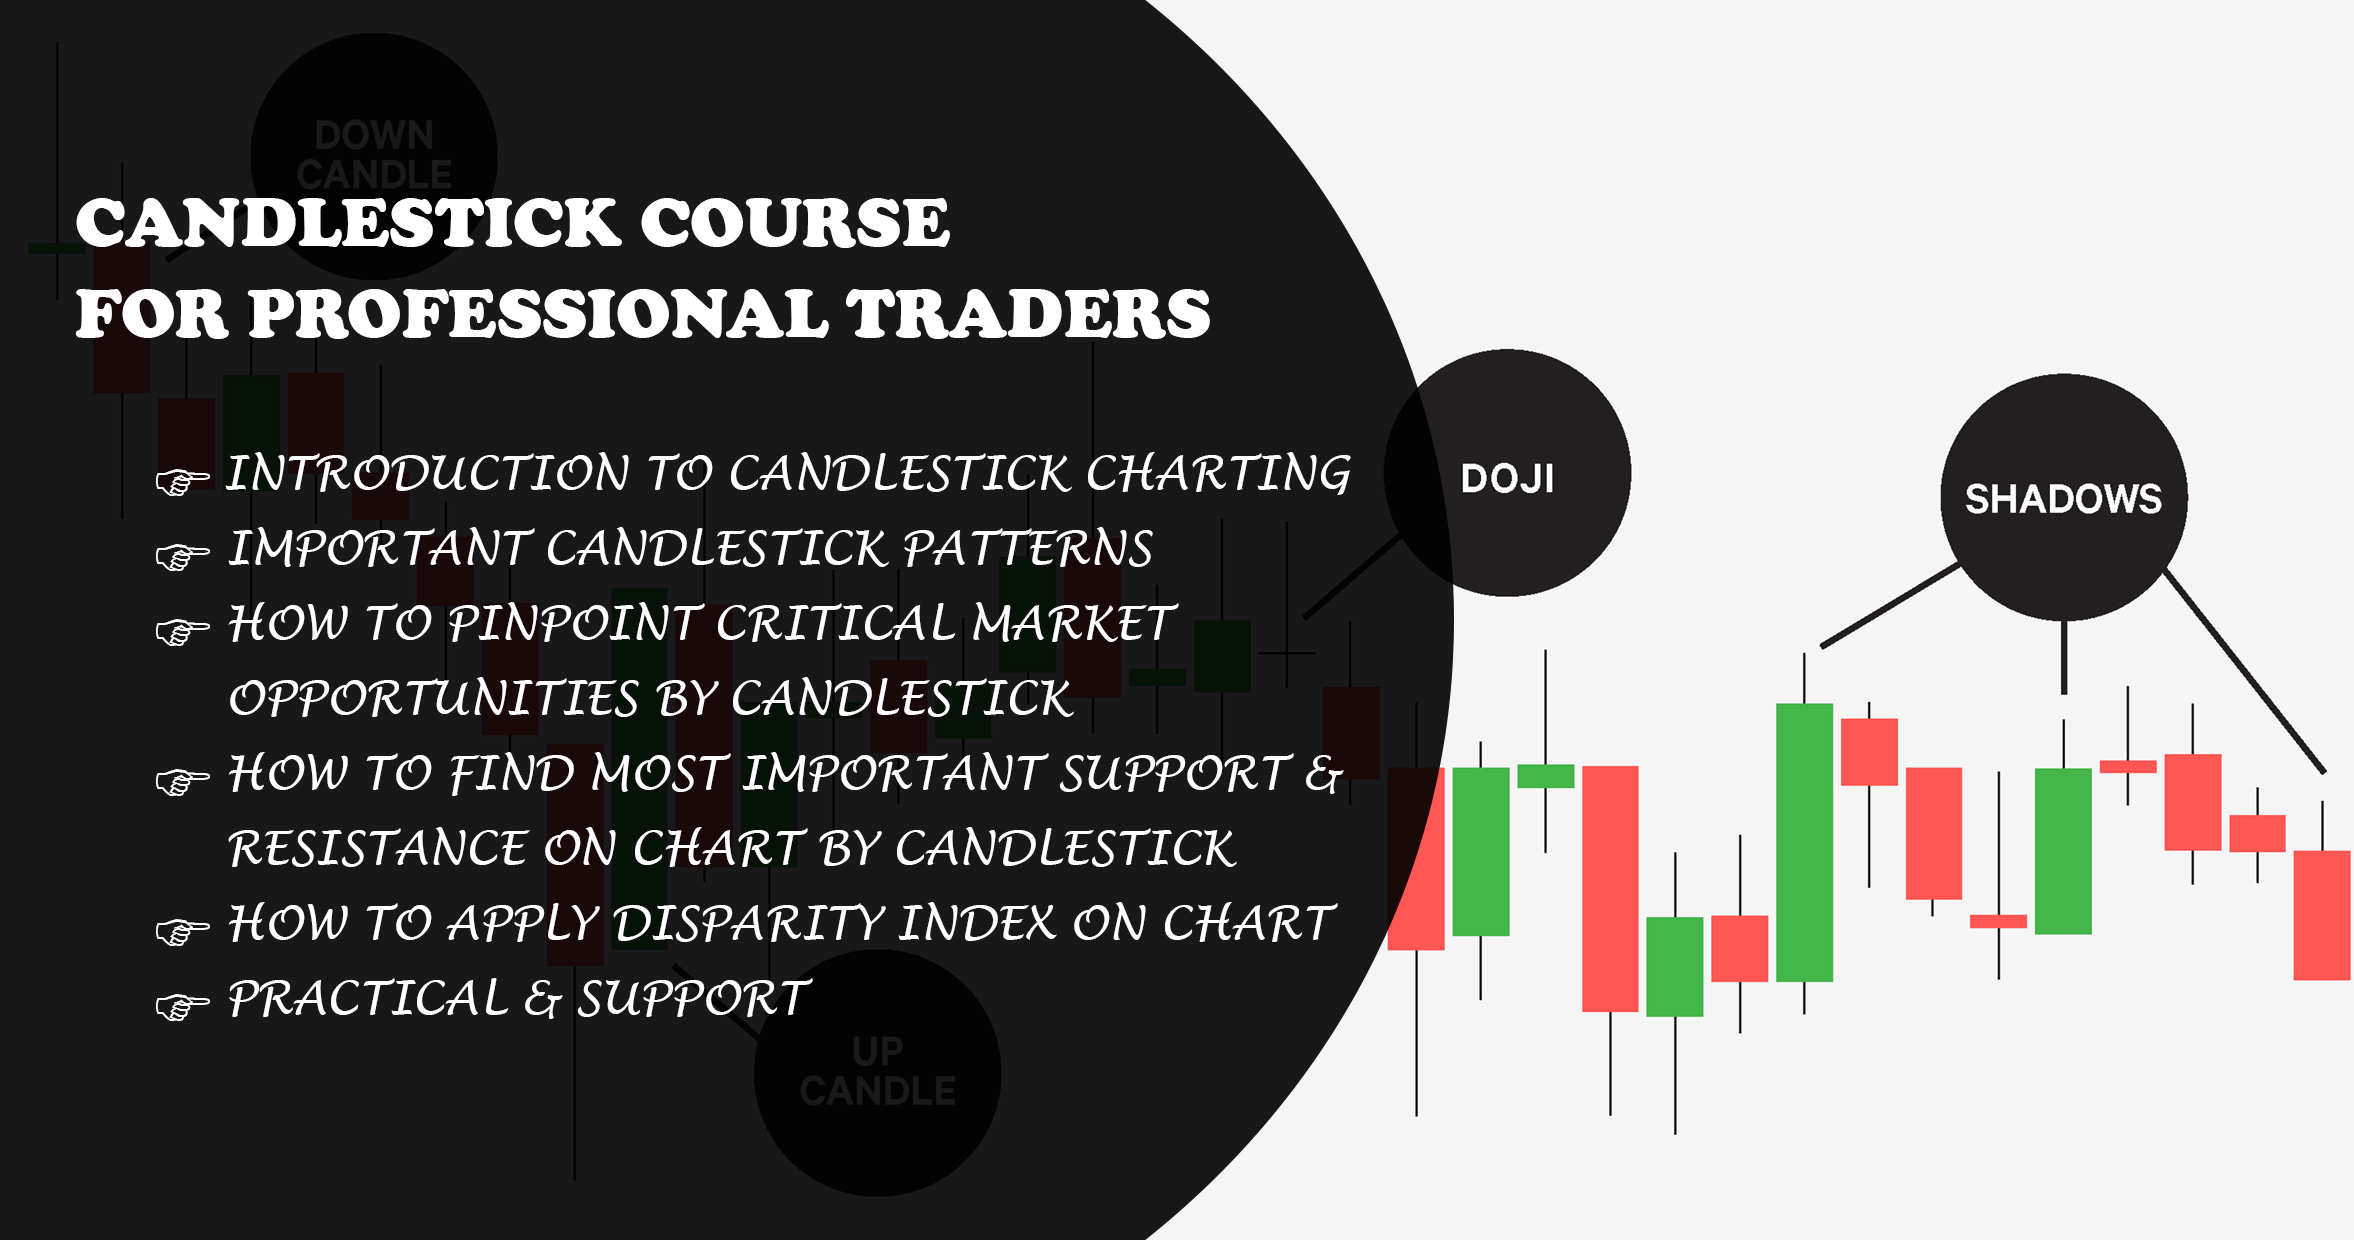
A candlestick chart (also called Japanese candlestick chart) is a style of financial chart used to describe price movements of a security, derivative, or currency.

What is the advantage of the candlestick?

Over time, the candlesticks group into recognizable patterns that investors or traders can use to make buying and selling decisions . It isa language of price behaviour. It will describe by three points.

  1. Traditional bar charts have little meaning by themselves, whereas candlestick charts display the action that took place in the market that day in much greater detail. A look at the price action in an equity over time allows you to use pattern analysis to determine the probability of that equity’s future movement.
  2. Candlesticks allow you to read the changes in the market’s determination of value, which otherwise is known as investor sentiment. Candlesticks do this by showing the interaction between buyers and sellers, which often is reflected in price movement. As such, candlestick charts provide an insight into the financial markets that does not exist with traditional bar charts
  3. Candlesticks visually provide a clear and easy-to-identify set of patterns that are highly accurate in predicting market trends. By using candlesticks, along with some basic technical analysis, you can easily begin to see patterns emerge in the market — and more importantly, you can start taking advantage of these patterns when you trade.

Intended Participants

  • Those who want to pursue a career as a Technical Analyst
  • Retail Traders & Investors
  • Financial Service Professionals
  • Brokers and Sub Brokers
  • Candlestick Method, Conception & Background
  • How to Draw a Candlestick Chart
  • The Importance of Different Part of the Candle
  • The Importance of R.P
  • The Importance of Doji
  • Hammer Candlestick Pattern
  • Hanging Man Candlestick Pattern
  • Bullish Engulfing Candlestick Pattern
  • Bearish Engulfing Candlestick Pattern
  • Bullish Harami Candlestick Pattern
  • Bearish Harami Candlestick Pattern
  • Piercing Line Pattern
  • Dark Cloud Cover Candlestick
  • Tri-Star Candlestick Pattern
  • Morning Star Candlestick Pattern
  • Evening Star Pattern
  • Shooting Star Candlestick
  • Upside Gap Two Crows Pattern
  • Three White Soldiers Candlestick
  • The Importance of Candlestick Sizes
  • The Importance of Candlestick Colors & Frequency
  • The Importance of Candlestick Record Session
  • Long White Candle at a Low Price Level
  • How to use Long White Candle to Confirm Support
  • Long White Candle Body Breaks Resistance
  • The Importance of Mid Point of the Long White Candlestick
  • Long Black Body Candle at a High Price Area
  • Long Black Body Candle Break Support
  • Long Black Candle or a Resistance
  • Different Point of Doji Candle
  • Last Engulfing Candlestick Pattern
  • Window Candlestick Pattern
  • Disparity Index

What is the advantage of candlestick charting method than Other charting methods?
I think the candlestick method is the language of the stock market. Candle make trader a doctor of the market. So you read & react to the symptoms of the market’s health through candles techniques may not be the same as another candle practitioner. You trade with candles will depend on your trading philosophy, your risk adversity & your temperament.